将 NetScaler MPX 14020 40G、MPX 14040 40G、MPX 14060 40G、MPX 14080 40G 设备转换为 NetScaler SDX 14020 40G、SDX 14040 40G、SDX 14060 40G、SDX 14080 40G 设备
您可以通过新的固态硬盘 (SSD) 升级软件,将 NetScaler MPX 设备转换为 NetScaler SDX 设备。NetScaler 提供现场转换套件,用于将 NetScaler MPX 设备迁移到 SDX 设备。
转换至少需要四个 SSD。
注意:Citrix 建议您在开始转换过程之前配置设备的远程管理 (LOM) 端口。有关 NetScaler 设备 LOM 端口的更多信息,请参阅 NetScaler SDX 设备的远程管理端口。
要将 MPX 设备转换为 SDX 设备,您必须通过连接到计算机或终端的控制台电缆访问设备。连接控制台电缆之前,请将计算机或终端配置为支持以下设置:
- VT100 终端仿真
- 9600 波特
- 8 数据位
- 1 停止位
- 奇偶校验和流量控制设置为无
将控制台电缆的一端连接到设备上的 RS232 串行端口,另一端连接到计算机或终端。
注意:要使用带 RJ-45 转换器的电缆,请将可选转换器插入控制台端口,然后将电缆连接到转换器。
Citrix® 建议您将 VGA 显示器连接到设备以监控转换过程,因为在转换过程中 LOM 连接会丢失。
连接电缆后,验证 MPX 设备的组件是否正常运行。然后,您就可以开始转换了。转换过程会修改 BIOS,安装 Citrix Hypervisor™ 和服务虚拟机映像,并将 NetScaler VPX 映像复制到固态硬盘。
转换过程还会为本地存储(SSD 插槽 #1 和 SSD 插槽 #2)和 NetScaler VPX™ 存储(SSD 插槽 #3 和 SSD 插槽 #4)设置独立磁盘冗余阵列 (RAID) 控制器。
转换过程完成后,修改设备的配置并应用新许可证。然后,您可以通过管理服务在现在是 NetScaler SDX™ 设备上预配 VPX 实例。
验证 MPX 设备组件的正常运行
- 访问控制台端口并输入管理员凭据。
- 从设备的命令行界面运行以下命令以显示序列号:show hardware
示例
show hardware
        Platform: NSMPX-14000-40G 12*CPU+16*F1X+4*F4X+2*E1K+2*CVM N3 250140
        Manufactured on: 3/21/2016
        CPU: 2600MHZ
        Host Id: 234913926
        Serial no: KZCHGCN810
        Encoded serial no: KZCHGCN810
Done
<!--NeedCopy-->
当您需要联系 Citrix 技术支持时,序列号可能会有所帮助。
3. 运行以下命令以显示活动接口的状态:
show interface
示例
show interface
1)      Interface 0/1 (Gig Ethernet 10/100/1000 MBits) #10
        flags=0xc020 <ENABLED, UP, UP, autoneg, HAMON, 802.1q>
        MTU=1500, native vlan=1, MAC=0c:c4:7a:41:ea:94, uptime 43h59m55s
       Requested: media AUTO, speed AUTO, duplex AUTO, fctl OFF,
                 throughput 0
        Actual: media UTP, speed 1000, duplex FULL, fctl OFF, throughput 1000
        LLDP Mode: NONE
        RX: Pkts(44337150) Bytes(2767558041) Errs(0) Drops(41260552) Stalls(0)
        TX: Pkts(128116) Bytes(9004699) Errs(0) Drops(0) Stalls(0)
        NIC: InDisc(0) OutDisc(0) Fctls(0) Stalls(0) Hangs(0) Muted(0)
        Bandwidth thresholds are not set.
2)      Interface 0/2 (Gig Ethernet 10/100/1000 MBits) #11
        flags=0x4000 <ENABLED, DOWN, down, autoneg, HAMON, 802.1q>
        MTU=1500, native vlan=1, MAC=0c:c4:7a:41:ea:95, downtime 44h00m08s
        Requested: media AUTO, speed AUTO, duplex AUTO, fctl OFF,
                throughput 0
        LLDP Mode: NONE
        RX: Pkts(0) Bytes(0) Errs(0) Drops(0) Stalls(0)
        TX: Pkts(0) Bytes(0) Errs(0) Drops(0) Stalls(0)
        NIC: InDisc(0) OutDisc(0) Fctls(0) Stalls(0) Hangs(0) Muted(0)
        Bandwidth thresholds are not set.
3)      Interface 10/1 (10G Ethernet) #17
        flags=0x4000 <ENABLED, DOWN, down, autoneg, HAMON, 802.1q>
        MTU=1500, native vlan=1, MAC=68:05:ca:30:e1:40, downtime 44h00m08s
        Requested: media AUTO, speed AUTO, duplex AUTO, fctl OFF,
                throughput 0
       LLDP Mode: NONE
        RX: Pkts(0) Bytes(0) Errs(0) Drops(0) Stalls(0)
        TX: Pkts(0) Bytes(0) Errs(0) Drops(0) Stalls(0)
        NIC: InDisc(0) OutDisc(0) Fctls(0) Stalls(0) Hangs(0) Muted(0)
        Bandwidth thresholds are not set.
4)      Interface 10/2 (10G Ethernet) #18
        flags=0x4000 <ENABLED, DOWN, down, autoneg, HAMON, 802.1q>
        MTU=1500, native vlan=1, MAC=68:05:ca:30:e1:41, downtime 44h00m08s
       Requested: media AUTO, speed AUTO, duplex AUTO, fctl OFF,
                 throughput 0
        LLDP Mode: NONE
        RX: Pkts(0) Bytes(0) Errs(0) Drops(0) Stalls(0)
        TX: Pkts(0) Bytes(0) Errs(0) Drops(0) Stalls(0)
        NIC: InDisc(0) OutDisc(0) Fctls(0) Stalls(0) Hangs(0) Muted(0)
        Bandwidth thresholds are not set.
5)      Interface 10/3 (10G Ethernet) #19
        flags=0x4000 <ENABLED, DOWN, down, autoneg, HAMON, 802.1q>
        MTU=1500, native vlan=1, MAC=68:05:ca:30:e1:42, downtime 44h00m08s
        Requested: media AUTO, speed AUTO, duplex AUTO, fctl OFF,
                throughput 0
        LLDP Mode: NONE
        RX: Pkts(0) Bytes(0) Errs(0) Drops(0) Stalls(0)
       TX: Pkts(0) Bytes(0) Errs(0) Drops(0) Stalls(0)
        NIC: InDisc(0) OutDisc(0) Fctls(0) Stalls(0) Hangs(0) Muted(0)
        Bandwidth thresholds are not set.
6)      Interface 10/4 (10G Ethernet) #20
        flags=0x4000 <ENABLED, DOWN, down, autoneg, HAMON, 802.1q>
        MTU=1500, native vlan=1, MAC=68:05:ca:30:e1:43, downtime 44h00m08s
        Requested: media AUTO, speed AUTO, duplex AUTO, fctl OFF,
                throughput 0
       LLDP Mode: NONE
       RX: Pkts(0) Bytes(0) Errs(0) Drops(0) Stalls(0)
        TX: Pkts(0) Bytes(0) Errs(0) Drops(0) Stalls(0)
        NIC: InDisc(0) OutDisc(0) Fctls(0) Stalls(0) Hangs(0) Muted(0)
        Bandwidth thresholds are not set.
7)      Interface 10/5 (10G Ethernet) #13
        flags=0x4000 <ENABLED, DOWN, down, autoneg, HAMON, 802.1q>
        MTU=1500, native vlan=1, MAC=68:05:ca:2e:6b:a0, downtime 44h00m08s
       Requested: media AUTO, speed AUTO, duplex AUTO, fctl OFF,
                throughput 0
        LLDP Mode: NONE
        RX: Pkts(0) Bytes(0) Errs(0) Drops(0) Stalls(0)
        TX: Pkts(0) Bytes(0) Errs(0) Drops(0) Stalls(0)
        NIC: InDisc(0) OutDisc(0) Fctls(0) Stalls(0) Hangs(0) Muted(0)
       Bandwidth thresholds are not set.
8)      Interface 10/6 (10G Ethernet) #14
       flags=0x4000 <ENABLED, DOWN, down, autoneg, HAMON, 802.1q>
        MTU=1500, native vlan=1, MAC=68:05:ca:2e:6b:a1, downtime 44h00m08s
        Requested: media AUTO, speed AUTO, duplex AUTO, fctl OFF,
                 throughput 0
       LLDP Mode: NONE
       RX: Pkts(0) Bytes(0) Errs(0) Drops(0) Stalls(0)
       TX: Pkts(0) Bytes(0) Errs(0) Drops(0) Stalls(0)
        NIC: InDisc(0) OutDisc(0) Fctls(0) Stalls(0) Hangs(0) Muted(0)
       Bandwidth thresholds are not set.
9)      Interface 10/7 (10G Ethernet) #15
        flags=0x4000 <ENABLED, DOWN, down, autoneg, HAMON, 802.1q>
       MTU=1500, native vlan=1, MAC=68:05:ca:2e:6b:a2, downtime 44h00m08s
        Requested: media AUTO, speed AUTO, duplex AUTO, fctl OFF,
                 throughput 0
       LLDP Mode: NONE
       RX: Pkts(0) Bytes(0) Errs(0) Drops(0) Stalls(0)
       TX: Pkts(0) Bytes(0) Errs(0) Drops(0) Stalls(0)
       NIC: InDisc(0) OutDisc(0) Fctls(0) Stalls(0) Hangs(0) Muted(0)
       Bandwidth thresholds are not set.
10)     Interface 10/8 (10G Ethernet) #16
        flags=0x4000 <ENABLED, DOWN, down, autoneg, HAMON, 802.1q>
       MTU=1500, native vlan=1, MAC=68:05:ca:2e:6b:a3, downtime 44h00m08s
       Requested: media AUTO, speed AUTO, duplex AUTO, fctl OFF,
                 throughput 0
        LLDP Mode: NONE
        RX: Pkts(0) Bytes(0) Errs(0) Drops(0) Stalls(0)
        TX: Pkts(0) Bytes(0) Errs(0) Drops(0) Stalls(0)
      NIC: InDisc(0) OutDisc(0) Fctls(0) Stalls(0) Hangs(0) Muted(0)
        Bandwidth thresholds are not set.
11)     Interface 10/9 (10G Ethernet) #0
       flags=0x4000 <ENABLED, DOWN, down, autoneg, HAMON, 802.1q>
       MTU=1500, native vlan=1, MAC=68:05:ca:30:e1:a0, downtime 44h00m08s
       Requested: media AUTO, speed AUTO, duplex AUTO, fctl OFF,
                throughput 0
       LLDP Mode: NONE
        RX: Pkts(0) Bytes(0) Errs(0) Drops(0) Stalls(0)
       TX: Pkts(0) Bytes(0) Errs(0) Drops(0) Stalls(0)
       NIC: InDisc(0) OutDisc(0) Fctls(0) Stalls(0) Hangs(0) Muted(0)
       Bandwidth thresholds are not set.
12)     Interface 10/10 (10G Ethernet) #1
        flags=0x4000 <ENABLED, DOWN, down, autoneg, HAMON, 802.1q>
        MTU=1500, native vlan=1, MAC=68:05:ca:30:e1:a1, downtime 44h00m08s
        Requested: media AUTO, speed AUTO, duplex AUTO, fctl OFF,
                 throughput 0
        LLDP Mode: NONE
        RX: Pkts(0) Bytes(0) Errs(0) Drops(0) Stalls(0)
        TX: Pkts(0) Bytes(0) Errs(0) Drops(0) Stalls(0)
        NIC: InDisc(0) OutDisc(0) Fctls(0) Stalls(0) Hangs(0) Muted(0)
        Bandwidth thresholds are not set.
13)     Interface 10/11 (10G Ethernet) #2
        flags=0x4000 <ENABLED, DOWN, down, autoneg, HAMON, 802.1q>
        MTU=1500, native vlan=1, MAC=68:05:ca:30:e1:a2, downtime 44h00m08s
        Requested: media AUTO, speed AUTO, duplex AUTO, fctl OFF,
                 throughput 0
        LLDP Mode: NONE
        RX: Pkts(0) Bytes(0) Errs(0) Drops(0) Stalls(0)
        TX: Pkts(0) Bytes(0) Errs(0) Drops(0) Stalls(0)
        NIC: InDisc(0) OutDisc(0) Fctls(0) Stalls(0) Hangs(0) Muted(0)
       Bandwidth thresholds are not set.
14)     Interface 10/12 (10G Ethernet) #3
        flags=0x4000 <ENABLED, DOWN, down, autoneg, HAMON, 802.1q>
        MTU=1500, native vlan=1, MAC=68:05:ca:30:e1:a3, downtime 44h00m08s
        Requested: media AUTO, speed AUTO, duplex AUTO, fctl OFF,
                  throughput 0
         LLDP Mode: NONE

         RX: Pkts(0) Bytes(0) Errs(0) Drops(0) Stalls(0)
         TX: Pkts(0) Bytes(0) Errs(0) Drops(0) Stalls(0)
         NIC: InDisc(0) OutDisc(0) Fctls(0) Stalls(0) Hangs(0) Muted(0)
         Bandwidth thresholds are not set.

 15)     Interface 10/13 (10G Ethernet) #4
         flags=0x4000 <ENABLED, DOWN, down, autoneg, HAMON, 802.1q>
         MTU=1500, native vlan=1, MAC=68:05:ca:30:e2:70, downtime 44h00m08s
         Requested: media AUTO, speed AUTO, duplex AUTO, fctl OFF,
                  throughput 0
         LLDP Mode: NONE
         RX: Pkts(0) Bytes(0) Errs(0) Drops(0) Stalls(0)
         TX: Pkts(0) Bytes(0) Errs(0) Drops(0) Stalls(0)
         NIC: InDisc(0) OutDisc(0) Fctls(0) Stalls(0) Hangs(0) Muted(0)
         Bandwidth thresholds are not set.
 16)     Interface 10/14 (10G Ethernet) #5
         flags=0x4000 <ENABLED, DOWN, down, autoneg, HAMON, 802.1q>
         MTU=1500, native vlan=1, MAC=68:05:ca:30:e2:71, downtime 44h00m15s
         Requested: media AUTO, speed AUTO, duplex AUTO, fctl OFF,
                  throughput 0
         LLDP Mode: NONE
         RX: Pkts(0) Bytes(0) Errs(0) Drops(0) Stalls(0)
         TX: Pkts(0) Bytes(0) Errs(0) Drops(0) Stalls(0)
         NIC: InDisc(0) OutDisc(0) Fctls(0) Stalls(0) Hangs(0) Muted(0)
         Bandwidth thresholds are not set.
 17)     Interface 10/15 (10G Ethernet) #6
         flags=0x4000 <ENABLED, DOWN, down, autoneg, HAMON, 802.1q>
         MTU=1500, native vlan=1, MAC=68:05:ca:30:e2:72, downtime 44h00m15s
         Requested: media AUTO, speed AUTO, duplex AUTO, fctl OFF,
                  throughput 0
         LLDP Mode: NONE
         RX: Pkts(0) Bytes(0) Errs(0) Drops(0) Stalls(0)
         TX: Pkts(0) Bytes(0) Errs(0) Drops(0) Stalls(0)
         NIC: InDisc(0) OutDisc(0) Fctls(0) Stalls(0) Hangs(0) Muted(0)
         Bandwidth thresholds are not set.
 18)     Interface 10/16 (10G Ethernet) #7
         flags=0x4000 <ENABLED, DOWN, down, autoneg, HAMON, 802.1q>
         MTU=1500, native vlan=1, MAC=68:05:ca:30:e2:73, downtime 44h00m15s
         Requested: media AUTO, speed AUTO, duplex AUTO, fctl OFF,
                  throughput 0
         LLDP Mode: NONE

         RX: Pkts(0) Bytes(0) Errs(0) Drops(0) Stalls(0)
         TX: Pkts(0) Bytes(0) Errs(0) Drops(0) Stalls(0)
         NIC: InDisc(0) OutDisc(0) Fctls(0) Stalls(0) Hangs(0) Muted(0)
         Bandwidth thresholds are not set.
 19)     Interface 40/1 (40G Ethernet) #9
         flags=0x4000 <ENABLED, DOWN, down, autoneg, HAMON, 802.1q>
         MTU=1500, native vlan=1, MAC=3c:fd:fe:9c:f9:98, downtime 44h00m15s
         Requested: media AUTO, speed AUTO, duplex AUTO, fctl OFF,
                  throughput 0
         LLDP Mode: NONE
         RX: Pkts(0) Bytes(0) Errs(0) Drops(0) Stalls(0)
         TX: Pkts(0) Bytes(0) Errs(0) Drops(0) Stalls(0)
         NIC: InDisc(0) OutDisc(0) Fctls(0) Stalls(0) Hangs(0) Muted(0)
         Bandwidth thresholds are not set.
 20)     Interface 40/2 (40G Ethernet) #21
         flags=0x4000 <ENABLED, DOWN, down, autoneg, HAMON, 802.1q>
         MTU=1500, native vlan=1, MAC=3c:fd:fe:9c:fa:68, downtime 44h00m15s
         Requested: media AUTO, speed AUTO, duplex AUTO, fctl OFF,
                  throughput 0
         LLDP Mode: NONE
         RX: Pkts(0) Bytes(0) Errs(0) Drops(0) Stalls(0)
         TX: Pkts(0) Bytes(0) Errs(0) Drops(0) Stalls(0)
         NIC: InDisc(0) OutDisc(0) Fctls(0) Stalls(0) Hangs(0) Muted(0)
         Bandwidth thresholds are not set.
 21)     Interface 40/3 (40G Ethernet) #12
         flags=0x4000 <ENABLED, DOWN, down, autoneg, HAMON, 802.1q>
         MTU=1500, native vlan=1, MAC=3c:fd:fe:9c:f9:f8, downtime 44h00m15s
         Requested: media AUTO, speed AUTO, duplex AUTO, fctl OFF,
                  throughput 0
         LLDP Mode: NONE
         RX: Pkts(0) Bytes(0) Errs(0) Drops(0) Stalls(0)
         TX: Pkts(0) Bytes(0) Errs(0) Drops(0) Stalls(0)
         NIC: InDisc(0) OutDisc(0) Fctls(0) Stalls(0) Hangs(0) Muted(0)
         Bandwidth thresholds are not set.
 22)     Interface 40/4 (40G Ethernet) #8
         flags=0x4000 <ENABLED, DOWN, down, autoneg, HAMON, 802.1q>
         MTU=1500, native vlan=1, MAC=3c:fd:fe:9c:f9:e0, downtime 44h00m15s
         Requested: media AUTO, speed AUTO, duplex AUTO, fctl OFF,
                  throughput 0
         LLDP Mode: NONE
         RX: Pkts(0) Bytes(0) Errs(0) Drops(0) Stalls(0)
         TX: Pkts(0) Bytes(0) Errs(0) Drops(0) Stalls(0)
         NIC: InDisc(0) OutDisc(0) Fctls(0) Stalls(0) Hangs(0) Muted(0)
         Bandwidth thresholds are not set.
 23)     Interface LO/1 (Netscaler Loopback interface) #22
         flags=0x20008020 <ENABLED, UP, UP>
         MTU=1500, native vlan=1, MAC=0c:c4:7a:41:ea:94, uptime 44h00m15s
         LLDP Mode: NONE
         RX: Pkts(103847611) Bytes(14441166499) Errs(0) Drops(0) Stalls(0)
         TX: Pkts(206723664) Bytes(20488047637) Errs(0) Drops(0) Stalls(0)
         Bandwidth thresholds are not set.
  Done
 <!--NeedCopy-->
4. 在 show interface 命令的输出中,验证所有接口均已启用,并且每个接口的状态都显示为 UP/UP。
注意:
-
仅当电缆连接到接口时,接口状态才显示为 UP/UP。
-
如果每个端口都没有 SFP+ 收发器,请分阶段验证接口。检查第一组接口后,拔下 SFP+ 收发器并将其插入下一组端口。
5. 对每个未处于 UP/UP 状态的接口运行以下命令:
enable interface 10/x
enable interface 40/x
<!--NeedCopy-->
其中 x 是新的接口编号。
示例:
enable interface 10/1
 Done
 > enable interface 40/1
 Done
<!--NeedCopy-->
6. 运行以下命令以验证电源状态是否正常: stat system –detail
示例
stat system -detail
 NetScaler Executive View
 System Information:
 Up since        Mon Mar 21 13:53:22 2016
 Memory usage (MB)                   1177
 InUse Memory (%)                    5.37
 Number of CPUs                         7
 System Health Statistics (Standard):
 CPU 0 Core Voltage (Volts)                      0.99
 CPU 1 Core Voltage (Volts)                      0.98
 Main 3.3 V Supply Voltage                       3.36
 Standby 3.3 V Supply Voltage                    3.31
 +5.0 V Supply Voltage                           5.06
 +12.0 V Supply Voltage                         12.08
 Battery Voltage (Volts)                         3.17
 Intel CPU Vtt Power(Volts)                      1.01
 5V Standby Voltage(Volts)                       0.00
 Voltage Sensor2(Volts)                          0.00
 CPU Fan 0 Speed (RPM)                           4650
 CPU Fan 1 Speed (RPM)                           4575
 System Fan Speed (RPM)                          4650
 System Fan 1 Speed (RPM)                        4650
 System Fan 2 Speed (RPM)                        4650
 CPU 0 Temperature (Celsius)                       42
 CPU 1 Temperature (Celsius)                       49
 Internal Temperature (Celsius)                    36
 Power supply 1 status                         NORMAL
 Power supply 2 status                         NORMAL
 Power supply 3 status                  NOT SUPPORTED
 Power supply 4 status                  NOT SUPPORTED
 System Disk Statistics:
 /flash Size (MB)                               16858
 /flash Used (MB)                                 186
 /flash Available (MB)                          15323
 /flash Used (%)                                    1
 /var Size (MB)                                143802
 /var Used (MB)                                   781
 /var Available (MB)                           131517
 /var Used (%)                                      0
 System Health Statistics(Auxiliary):
 Voltage 0 (Volts)                               1.49
 Voltage 1 (Volts)                               1.49
 Voltage 2 (Volts)                               1.50
 Voltage 3 (Volts)                               1.49
 Voltage 4 (Volts)                               1.49
 Voltage 5 (Volts)                               0.00
 Voltage 6 (Volts)                               0.00
 Voltage 7 (Volts)                               0.00
 Fan 0 Speed (RPM)                               4650
 Fan 1 Speed (RPM)                                  0
 Fan 2 Speed (RPM)                                  0
 Fan 3 Speed (RPM)                                  0
 Temperature 0 (Celsius)                           28
 Temperature 1 (Celsius)                           43
 Temperature 2 (Celsius)                            0
 Temperature 3 (Celsius)                            0
  Done
<!--NeedCopy-->
7. 运行以下命令以生成系统配置数据和统计信息的 tar 包: show techsupport
示例
show techsupport
 showtechsupport data collector tool - $Revision: #2 $!
 NetScaler version 10.5
 Creating /var/tmp/support ....
 The NS IP of this box is 192.168.100.1
 Current HA state: Primary (or this is not part of HA pair!)
 All the data will be collected under
         /var/tmp/support/collector_P_192.168.100.1_23Mar2016_10_00
 Copying selected configuration files from nsconfig ....
 Copying WebInterface configuration files (if WI is installed) ....
         .... WI is not installed on this system. Nothing to copy.
 Running shell commands ....
 Running CLI show commands ....
 Running CLI stat commands ....
 Running vtysh commands ....
 Determining newnslog files to archive ....
         Last newnslog file index=1
         Warning! Missing newnslog.0 and newnslog.0.tar and newnslog.0.tar.gz file!
         Warning! Missing newnslog.199 and newnslog.199.tar and newnslog.199.tar.gz file!
         Warning! Missing newnslog.198 and newnslog.198.tar and newnslog.198.tar.gz file!
         Warning! Missing newnslog.197 and newnslog.197.tar and newnslog.197.tar.gz file!
         Warning! Missing newnslog.196 and newnslog.196.tar and newnslog.196.tar.gz file!
         Five newnslog files missing

         .... copied 2 files from this directory.
 Copying core files from /var/core .... (last 5 files created within the last week)
         .... Nothing to copy .... No files created within the last one week
 Copying core files from /var/crash .... (last 5 files created within the last week)
         .... Nothing to copy .... No files created within the last one week
 Copying imported files and mapping files ....
 Copying GSLB location database files ....
 Copying files from /var/log/db ....
 Copying messages,ns.log,dmesg and other log files ....
 Warning : cluster showtech node failure log file: /var/tmp/support/collector_P_192.168.100.1_23Mar2016_10_00/cluster_showtech_node_failure.log is not present
 Archiving all the data into "/var/tmp/support/collector_P_192.168.100.1_23Mar2016_10_00.tar.gz" ....
 Created a symbolic link for the archive with /var/tmp/support/support.tgz
 /var/tmp/support/support.tgz  ---- points to ---> /var/tmp/support/collector_P_192.168.100.1_23Mar2016_10_00.tar.gz
 If this node is part of HA pair, please run it on the other node also!!
 Done
<!--NeedCopy-->
注意:命令输出位于 /var/tmp/support/collector_<IP_address>_P_<date>.tar.gz 文件中。将此文件复制到另一台计算机以供将来参考。当您需要联系 Citrix 技术支持时,命令输出可能会有所帮助。
8. 在命令行界面,切换到 shell 提示符。键入: shell
示例
shell
 Copyright (c) 1992-2013 The FreeBSD Project.
 Copyright (c) 1979, 1980, 1983, 1986, 1988, 1989, 1991, 1992, 1993, 1994
         The Regents of the University of California. All rights reserved.
 <!--NeedCopy-->
9. 运行以下命令以根据您的设备验证可用的 Cavium 卡数量:
root@ns# grep "cavium" /var/nslog/dmesg.boot
示例
 /var/nslog/dmesg.boot
 Cavium cavium_probe : found card  0x177d,device=0x11
 cavium0 mem 0xde200000-0xde2fffff irq 32 at device 0.0 on pci3
 cavium0: [ITHREAD]
 Cavium cavium_probe : found card  0x177d,device=0x11
 cavium1 mem 0xfb400000-0xfb4fffff irq 64 at device 0.0 on pci136
 cavium1: [ITHREAD]
 Cavium cavium_probe : found card  0x177d,device=0x11
 cavium0 mem 0xde200000-0xde2fffff irq 32 at device 0.0 on pci3
 cavium0: [ITHREAD]
 Cavium cavium_probe : found card  0x177d,device=0x11
 cavium1 mem 0xfb400000-0xfb4fffff irq 64 at device 0.0 on pci136
 cavium1: [ITHREAD]
 root@ns#
 <!--NeedCopy-->
10. 运行以下命令以根据您的设备验证为共享内存保留的 RAM 内存:
root@ns# grep “memory” /var/nslog/dmesg.boot
示例
 /var/nslog/dmesg.boot
 real memory  = 70866960384 (67584 MB)
 avail memory = 66206515200 (63139 MB)
 NS-KERN map_shared_mem_ioctl (cpu 11, NSPPE-00): Reserving 596 MB for shared memory type 0
 real memory  = 70866960384 (67584 MB)
 avail memory = 66206515200 (63139 MB)
 root@ns#
 <!--NeedCopy-->
11. 运行以下命令以根据您的设备验证 CPU 核心数量:
root@ns# grep "cpu" /var/nslog/dmesg.boot
示例
 root@ns# grep "cpu" /var/nslog/dmesg.boot
  cpu0 (BSP): APIC ID:  0
  cpu1 (AP): APIC ID:  2
  cpu2 (AP): APIC ID:  4
  cpu3 (AP): APIC ID:  6
  cpu4 (AP): APIC ID:  8
  cpu5 (AP): APIC ID: 10
  cpu6 (AP): APIC ID: 32
  cpu7 (AP): APIC ID: 34
  cpu8 (AP): APIC ID: 36
  cpu9 (AP): APIC ID: 38
  cpu10 (AP): APIC ID: 40
  cpu11 (AP): APIC ID: 42
 cpu0: <ACPI CPU> on acpi0
 cpu1: <ACPI CPU> on acpi0
 cpu2: <ACPI CPU> on acpi0
 cpu3: <ACPI CPU> on acpi0
 cpu4: <ACPI CPU> on acpi0
 cpu5: <ACPI CPU> on acpi0
 cpu6: <ACPI CPU> on acpi0
 cpu7: <ACPI CPU> on acpi0
 cpu8: <ACPI CPU> on acpi0
 cpu9: <ACPI CPU> on acpi0
 cpu10: <ACPI CPU> on acpi0
 cpu11: <ACPI CPU> on acpi0
 est0: <Enhanced SpeedStep Frequency Control> on cpu0
 p4tcc0: <CPU Frequency Thermal Control> on cpu0
 est1: <Enhanced SpeedStep Frequency Control> on cpu1
 p4tcc1: <CPU Frequency Thermal Control> on cpu1
 est2: <Enhanced SpeedStep Frequency Control> on cpu2
 p4tcc2: <CPU Frequency Thermal Control> on cpu2
 est3: <Enhanced SpeedStep Frequency Control> on cpu3
 p4tcc3: <CPU Frequency Thermal Control> on cpu3
 est4: <Enhanced SpeedStep Frequency Control> on cpu4
 p4tcc4: <CPU Frequency Thermal Control> on cpu4
 est5: <Enhanced SpeedStep Frequency Control> on cpu5
 p4tcc5: <CPU Frequency Thermal Control> on cpu5
 est6: <Enhanced SpeedStep Frequency Control> on cpu6
 p4tcc6: <CPU Frequency Thermal Control> on cpu6
 est7: <Enhanced SpeedStep Frequency Control> on cpu7
 p4tcc7: <CPU Frequency Thermal Control> on cpu7
 est8: <Enhanced SpeedStep Frequency Control> on cpu8
 p4tcc8: <CPU Frequency Thermal Control> on cpu8
 est9: <Enhanced SpeedStep Frequency Control> on cpu9
 p4tcc9: <CPU Frequency Thermal Control> on cpu9
 est10: <Enhanced SpeedStep Frequency Control> on cpu10
 p4tcc10: <CPU Frequency Thermal Control> on cpu10
 est11: <Enhanced SpeedStep Frequency Control> on cpu11
 p4tcc11: <CPU Frequency Thermal Control> on cpu11
 NS-KERN map_shared_mem_ioctl (cpu 11, NSPPE-00): Reserving 596 MB for shared memory type 0
  cpu0 (BSP): APIC ID:  0
  cpu1 (AP): APIC ID:  2
  cpu2 (AP): APIC ID:  4
  cpu3 (AP): APIC ID:  6
  cpu4 (AP): APIC ID:  8
  cpu5 (AP): APIC ID: 10
  cpu6 (AP): APIC ID: 32
  cpu7 (AP): APIC ID: 34
  cpu8 (AP): APIC ID: 36
  cpu9 (AP): APIC ID: 38
  cpu10 (AP): APIC ID: 40
  cpu11 (AP): APIC ID: 42
 cpu0: <ACPI CPU> on acpi0
 cpu1: <ACPI CPU> on acpi0
 cpu2: <ACPI CPU> on acpi0
 cpu3: <ACPI CPU> on acpi0
 cpu4: <ACPI CPU> on acpi0
 cpu5: <ACPI CPU> on acpi0
 cpu6: <ACPI CPU> on acpi0
 cpu7: <ACPI CPU> on acpi0
 cpu8: <ACPI CPU> on acpi0
 cpu9: <ACPI CPU> on acpi0
 cpu10: <ACPI CPU> on acpi0
 cpu11: <ACPI CPU> on acpi0
 est0: <Enhanced SpeedStep Frequency Control> on cpu0
 p4tcc0: <CPU Frequency Thermal Control> on cpu0
 est1: <Enhanced SpeedStep Frequency Control> on cpu1
 p4tcc1: <CPU Frequency Thermal Control> on cpu1
 est2: <Enhanced SpeedStep Frequency Control> on cpu2
 p4tcc2: <CPU Frequency Thermal Control> on cpu2
 est3: <Enhanced SpeedStep Frequency Control> on cpu3
 p4tcc3: <CPU Frequency Thermal Control> on cpu3
 est4: <Enhanced SpeedStep Frequency Control> on cpu4
 p4tcc4: <CPU Frequency Thermal Control> on cpu4
 est5: <Enhanced SpeedStep Frequency Control> on cpu5
 p4tcc5: <CPU Frequency Thermal Control> on cpu5
 est6: <Enhanced SpeedStep Frequency Control> on cpu6
 p4tcc6: <CPU Frequency Thermal Control> on cpu6
 est7: <Enhanced SpeedStep Frequency Control> on cpu7
 p4tcc7: <CPU Frequency Thermal Control> on cpu7
 est8: <Enhanced SpeedStep Frequency Control> on cpu8
 p4tcc8: <CPU Frequency Thermal Control> on cpu8
 est9: <Enhanced SpeedStep Frequency Control> on cpu9
 p4tcc9: <CPU Frequency Thermal Control> on cpu9
 est10: <Enhanced SpeedStep Frequency Control> on cpu10
 p4tcc10: <CPU Frequency Thermal Control> on cpu10
 est11: <Enhanced SpeedStep Frequency Control> on cpu11
 p4tcc11: <CPU Frequency Thermal Control> on cpu11
 root@ns#
 <!--NeedCopy-->
12. 运行以下命令以验证 /var 驱动器是否已挂载为 /dev/ar0s1a:root@ns# df –h
示例
 root@ns# df -h
 Filesystem     Size    Used   Avail Capacity  Mounted on
 /dev/md0       327M    317M    3.1M    99%    /
 devfs          1.0k    1.0k      0B   100%    /dev
 procfs         4.0k    4.0k      0B   100%    /proc
 /dev/ar0s1a     16G    186M     15G     1%    /flash
 /dev/ar0s1e    140G    857M    128G     1%    /var
 root@ns#
 <!--NeedCopy-->
13. 键入以下命令以运行 ns_hw_err.bash 脚本,该脚本用于检查潜在的硬件错误:root@ns# ns_hw_err.bash
示例
 root@ns# ns_hw_err.bash
 NetScaler NS10.5: Build 59.71.nc, Date: Mar  2 2016, 05:22:19
 platform: serial KZCHGCN810
 platform: sysid 250140 - NSMPX-14000-40G 12*CPU+16*F1X+4*F4X+2*E1K+2*CVM N3
 HDD MODEL: ar0: 227328MB <Intel MatrixRAID RAID1> status: READY

 Generating the list of newnslog files to be processed...
 Generating the events from newnslog files...
 Checking for HDD errors...
 Checking for HDD SMART errors...
 Checking for Flash errors...
 /var/nslog/dmesg.boot:* DEVELOPER mode - run NetScaler manually! *
 /var/tmp/ns_hw_tmp_10831//dmesg-a.out:* DEVELOPER mode - run NetScaler manually! *
 ******************************************
 FOUND        2 Flash errors: DEVELOPER mode - run NetScaler manually
 ******************************************
 Checking for Mega Raid Controller errors...
 Checking for SSL errors...
 Checking for BIOS errors...
 Checking for SMB errors...
 Checking for MotherBoard errors...
 Checking for CMOS errors...
         License year: 2016: OK
 License server failed at startup. Check /var/log/license.log
 Vendor daemon failed at startup. Check /var/log/license.log
 Checking for SFP/NIC errors...
 Checking for Firmware errors...
 Checking for License errors...
 Checking for Undetected CPUs...
 Checking for DIMM flaps...
 Checking for LOM errors...
 Checking the Power Supply Errors...
 root@ns#
 <!--NeedCopy-->
14. 重要提示: 从网络中物理断开除 LOM 端口之外的所有端口,包括管理端口。
15. 在 shell 提示符下,切换到 NetScaler 命令行。键入:exit
示例
root@ns# exit
 logout
  Done
 <!--NeedCopy-->
16. 运行以下命令以关闭设备。系统会询问您是否要完全停止 NetScaler。键入:shutdown -p now
示例
root@ns#
 root@ns# exit
 logout
  Done
 <!--NeedCopy-->
升级设备
要升级设备,请执行以下步骤:
- 关闭 NetScaler® 设备电源。
- 在设备的背面找到插槽 #1 和插槽 #2 中的两个固态硬盘 (SSD),如下图所示:
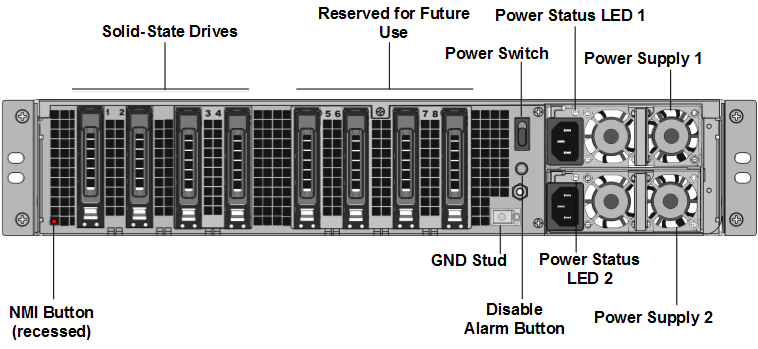
3. 验证更换的固态硬盘 (SSD) 是否是您的 NetScaler 型号所需的硬盘。转换至少需要四个 SSD。NetScaler 标签位于其中一个固态硬盘的顶部,该硬盘预装了新版 BIOS 和所需 NetScaler SDX Management Service 的最新版本。此 SSD 必须安装在插槽 # 1 中。
4. 按下驱动器盖板的安全闩锁,同时拉动驱动器手柄,卸下 SSD。
5. 在新的经 NetScaler 认证的 SSD 驱动器上,将驱动器手柄完全向左打开,然后将新驱动器尽可能深地插入插槽 #1。
6. 要固定驱动器,请将手柄与设备的背面齐平关闭,以便驱动器牢固地锁定在插槽中。
重要提示:SSD 的方向很重要。插入驱动器时,请确保 NetScaler 产品标签位于侧面。
7. 在插槽 # 2 中插入第二个经 NetScaler 认证的 SSD,其容量与插槽 #1 中的 SSD 匹配。
注意:如果您的设备许可证是 14040 40G、14060 40G、14080 40G,请在插槽 #3、#4、#5 和 #6 中插入更多空白的经 NetScaler 认证的 SSD。
| NetScaler SDX 型号 | 包含的虚拟实例 | 平台最大值 | 基本型号包含的 SSD | 用于最大实例的额外 SSD |
| SDX 14020 40G | 5 | 25 | 两个 240 GB;两个 300 GB | 两个 300 GB |
| SDX 14040 40G, SDX 14060 40G, SDX 14080 40G | 25 | 25 | 两个 240 GB;四个 300 GB | N/A |
重要提示:不支持混用新旧 SSD。插槽 #1 和插槽 #2 中的 SSD(构成第一个 RAID 对(本地存储))必须具有相同的大小和类型。同样,插槽 #3 和插槽 #4 中的 SSD(构成第二个 RAID 对(VPX 存储))必须具有相同的大小和类型。只能使用所提供的转换套件中的驱动器。
8. 断开数据端口和管理端口的所有网线。
9. 启动 NetScaler 设备。有关说明,请参阅《安装硬件》中的“打开设备电源”。
转换过程大约需要 30 分钟,在此期间您不得对设备进行电源循环。整个转换过程可能在控制台上不可见,并且可能显示为无响应。
转换过程会更新 BIOS,安装 Citrix Hypervisor 和管理服务操作系统,并将 NetScaler VPX 映像复制到 SSD 以进行实例预配,并形成 Raid1 对。
注意:设备的序列号保持不变。
10. 在转换过程中保持控制台电缆连接。等待过程完成,此时将出现 netscaler-sdx login: 提示符。
11. 在转换过程中,LOM 端口连接可能会丢失,因为它会将 IP 地址重置为默认值 192.168.1.3。转换状态输出可在 VGA 显示器上查看。
12. 设备从 MPX 转换为 SDX 后,默认凭据将从 nsroot/nsroot 更改为 root/nsroot。
13. 为确保转换成功,请验证 FVT 结果是否指示成功。运行以下命令:tail /var/log/fvt/fvt.log
重新配置已转换的设备
转换过程完成后,设备将不再具有其以前的工作配置。因此,您只能使用默认 IP 地址 192.168.100.1/16 通过 Web 浏览器访问设备。在网络 192.168.0.0 上配置一台计算机,并使用交叉以太网电缆将其直接连接到设备的管理端口 (0/1),或者通过网络集线器使用直通以太网电缆访问 NetScaler SDX 设备。使用默认凭据登录,然后执行以下操作:
- 选择“Configuration”(配置)选项卡。
- 验证“System Resource”(系统资源)部分是否显示了 NetScaler SDX 设备准确的 CPU 核心数、SSL 核心数和总内存。
- 选择“System”(系统)节点,然后在“Set Up Appliance”(设置设备)下,单击“Network Configuration”(网络配置)以修改管理服务的网络信息。
- 在“Modify Network Configuration”(修改网络配置)对话框中,指定以下详细信息:
- Interface*—客户端连接到管理服务的接口。可能的值:0/1、0/2。默认值:0/1。
- Citrix Hypervisor 的 IP 地址*—这是 Citrix Hypervisor 的 IP 地址。
- Management Service IP Address*—管理服务的 IP 地址。
- Netmask*—SDX 设备所在子网的子网掩码。
- Gateway*—网络的默认网关。
- DNS Server—DNS 服务器的 IP 地址。
*必填参数
-
单击确定。由于网络信息已更改,与管理服务的连接已丢失。
-
将 NetScaler SDX 设备的管理端口 0/1 连接到交换机,以便通过网络访问它。浏览到之前使用的 IP 地址,并使用默认凭据登录。
-
应用新许可证。有关说明,请参阅 SDX 许可概述。
-
导航到 Configuration > System,并在 System Administration 组中,单击 Reboot Appliance。单击 Yes 确认。现在,您已准备好在 NetScaler SDX 设备上预配 VPX 实例。有关说明,请参阅 预配 NetScaler 实例。